Here you can find useful information for your research project such as code snippets, test data etc.
OSM MapViewer
This is an archive of a complete netbeans project realizing a very simple OSM Map Viewer. The sample code is based on the jXMapKit widget and allows to scroll/zoom into OSM Maps. A very simple routine also reads a set of segments form a file and draws it ontop of the map.
It is a good starting point to implement your own route planner or anything that requires visualization of data ontop of a map.
Data Sets

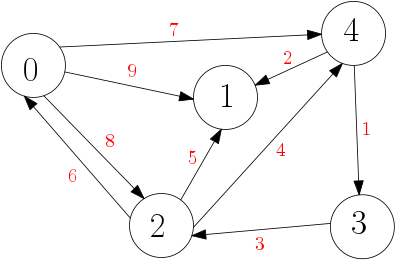
‘Toy’ road network:
- toy.fmi; n=5, m=9
This represents the following graph:
Format of the file:
- number of nodes
- number of edges
- for each node: nodeID nodeID2 latitude longitude elevation
- for each edge: srcIDX trgIDX cost type maxspeed
- nodeID2, elevation, type and maxspeed can be ignored for now
Different road networks (car only):
- Mecklenburg-Vorpommern: MV.fmi.bz2; n=6,441,199, m=1,305,996
- Regierungsbezirk Stuttgart: stgtregbz.fmi.bz2; n=1,132,113, m=2,292,887
- Baden-Württemberg: bw.fmi.bz2; n=3,600,520, m=7,300,290
- Deutschland: germany.fmi.bz2; n=25,115,477, m=50,790,030
For sanity check: DistTables.tar.bz2
Contraction hierarchy: stgtregbz_ch.fmi.bz2 (note that it is advisable to reorder the nodes according to their level to get the best performance from CH)
Format of the file:
- as above but nodes have an additional column “level” and edges have 2 additional columns “child1” and “child2”
Map Matching: trajectory_data.tar.gz network of Germany with map matched trajectories
